Are the complexities of processing vast volumes of data holding you back from drawing meaningful and actionable insights? Build agile and extensible data platforms to break silos of information and create interactive reports with our data visualization services.
Our expert data analysts help you navigate the intricacies of data interpretation using advanced data analytics tools. This involves transforming your raw, unstructured data into visually compelling, easy-to-understand graphics that empower you to make informed decisions. We help you cut through the noise and swiftly uncover the insights that matter. Besides, delegating your requirements to us frees you from the enduring obligations of staff training and software licensing.
Partner with us to unify fragmented data reserves and obtain a holistic view without operational bottlenecks.
Data Visualization Solutions We Offer
We harness the power of advanced analytics, machine learning algorithms, and state-of-the-art visualization tools to provide solutions tailored to your strategic goals.
Explore our wide range of services, designed to empower your business.

Dashboard Development Services
We develop interactive dashboards that provide an at-a-glance view of your key performance indicators. Our dashboards are customizable, thus helping you monitor performance, track progress, and make informed decisions.

Analytics and BI Powered Data Modeling
We format and model your data to create extensive reports to help you uncover insights, trends, and more. Our comprehensive data analysis improves reporting capabilities and equips you with a 360-degree view of your business.

Data Visualization Optimization
We specialize in optimizing data visualizations for better readability, understanding, and decision-making. Our experts use advanced approaches to refine your data visualizations, making them more intuitive, interactive, and insightful.
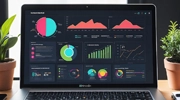
Dashboard Optimization
Improve the functionality, usability, and overall performance of your dashboards with our optimization solutions. Our team ensures your dashboards are intuitive, responsive, and aligned with your business objectives.

Data Migration from Tableau to Power BI
Our seamless processes ensure a smooth transition from Tableau to Power BI. We handle the extraction, transformation, and loading of your data with minimal disruptions to your business operations.

Industry Report Development
Our team excels in developing industry reports that provide in-depth insights into market trends, competitive landscape, and customer behavior. We leverage advanced analytics techniques to ensure these reports are comprehensive, accurate, and data-driven.

Ongoing Data Visualization Support
We provide ongoing support to ensure your visual reports and dashboards remain updated. Our team is available round-the-clock to address issues, make necessary updates, and optimize your visualizations for maximum impact.
Data Visualization Techniques We Excel In
We are proficient in assisting our clients with an array of data visualization techniques. These techniques, refined through years of experience, enable us to depict your data in ways that are not only visually appealing but also easy to understand.
Temporal data visualizations
Hierarchical data visualizations
Multi-dimensional data visualizations
Geospatial data visualizations
Our Technological Competencies


What Sets Our Data Visualization Company Apart?
Make your data segregation and modeling processes simpler and more rewarding with our data visualization consulting services. Our commitment to excellence, coupled with our technological prowess, allows us to serve you better. Our partnership promises to deliver -
Access to Expertise
You leverage specialized expertise when you hire visualization experts. This leads to the creation of high-quality, insightful data visualizations that are tailored to your specific needs.
The Latest Data Models and Formats
We stay on top of the latest trends in data visualization to ensure the reports and visuals we create are accurate and adheres to global standards.
Consistent Support
When you outsource data visualization services to us, we offer ongoing support and updates to ensure your data visualizations remain relevant and effective. This makes your reports highly accurate and reliable.
Data Security Assurance
We follow multi-level security protocols and provide project access only to authorized personnel. Our experts sign an NDA agreement to ensure that your sensitive data is always protected.
Improved Business Communication
Our tools enhance business communication by presenting complex data in an easily understandable format, fostering mutual understanding and productive collaboration.
Data Security and Compliance
We prioritize data security and ensure our services comply with industry regulations, providing your business with the utmost protection for your sensitive information.
Additional Services You Can Benefit From
We design dynamic dashboards using real-time insights to highlight crucial business metrics for informed decision-making.
Leverage our services to unlock the potential of your data, as we follow innovative analytics approaches to provide actionable insights.
Update your data infrastructure to boost efficiency, scalability, and performance with our services. We help you make the most of the digital transformation.
Experience the power of automation in improving efficiency and reducing manual errors in your business processes with our services.
Streamline your data entry tasks by turning your scanned documents and images into editable and searchable data.
Cognitive Process Automation Services
Harness the power of AI to optimize your business operations for enhanced productivity and cost efficiency.
Secure, Scalable, and Strategic Data Visualization Support
We harness the power of advanced data analytics, machine learning algorithms, and cutting-edge visualization tools to bring your data to life. Our visualizations are not just aesthetically appealing but are designed to provide a holistic view of your business performance, market trends, and customer behavior. When you choose to hire data visualization experts from us, you gain access to a skilled team, without the ongoing burden of recruitment, training, and infrastructure costs. Our services are flexible, adaptable to your specific needs, and come with the assurance of data security and confidentiality.
Transform the way you interpret and communicate data. Let’s turn your data into a strategic asset that fuels growth.
FAQs
Avail best-in-class services at affordable rates
Our Customers


Software Development Case Studies
-
Flatworld Implemented a ServiceNow Solution for a US-based Award Winning Firm
-
FWS Provided Swift and Impeccable ServiceNow Implementation Services
-
Flatworld Provided Power BI Services to a UK-based Data Analytics Firm
-
Developed an e-Learning Platform for a Global IT Organization
-
Bilingual OpenCart e-commerce Solution for Canadian Boat Manufacturer
3rd Edition Middle East Banking AI and Analytics Summit

USA
Flatworld Solutions
116 Village Blvd, Suite 200, Princeton, NJ 08540
PHILIPPINES
Aeon Towers, J.P. Laurel Avenue, Bajada, Davao 8000
KSS Building, Buhangin Road Cor Olive Street, Davao City 8000
INDIA
Survey No.11, 3rd Floor, Indraprastha, Gubbi Cross, 81,
Hennur Bagalur Main Rd, Kuvempu Layout, Kothanur, Bengaluru, Karnataka 560077

