

Business Intelligence Dashboard Creation Services
Modern day businesses generate Zettabytes of raw data. Once this meta data goes through enhanced analytics and is presented in the form of easy to comprehend analytical reports, it becomes a great source of valuable business insights and knowledge. However, one of the biggest challenges being faced by global businesses is the inability to extract and analyze data efficiently.
As your partner, Flatworld Solutions can collect, organize, and transform your data into rich visuals so that you can focus on the KPIs driving your business. Our expertly prepared dashboards ensure you always remain up-to-date with the latest information, recognize trends as they happen, and push your business further by taking informed decisions.
BI Dashboard Creation Services
Over the past 20 years, we have created a niche for affordable, insightful, and easy-to-use dashboards and enterprise reporting services. Our BI dashboards can be easily created on the fly, and provide you with maximum analytical flexibility while being dynamic in nature. Our dashboard creation services include -
Creating interactive and dynamic dashboards
Modification and streamlining of existing dashboards as per the your request
Incorporating dashboards within your current OS
Creating add-ons for Xcelsius dashboards, amongst others
Dashboard Training and Maintenance
Dashboard consultation including Visualization best practices, successful deployment practices, KPI development, etc.
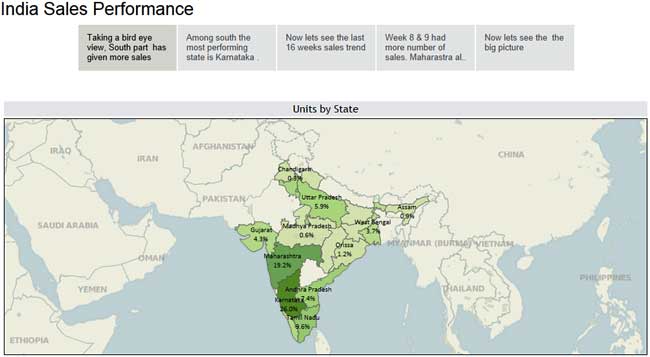
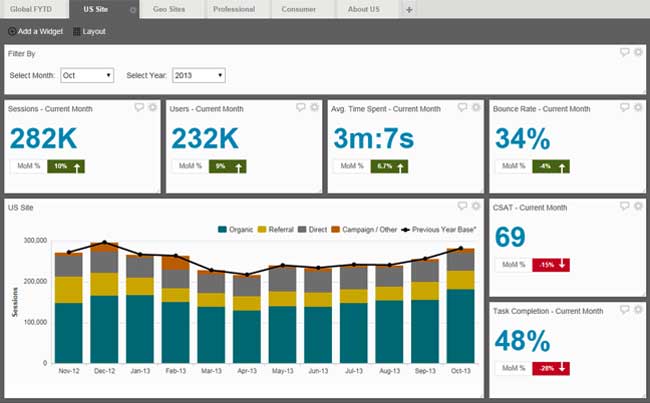
Our dashboards are created in a manner so as to empower even non-technical users with the ability to access and interact with them. Our easy to use dashboards widgets allow to you fine-tune and change the settings as per your requirements. From creating simple geographical maps, line charts to determine trends, pie charts to compare results, to scatter plots to determine correlations, we can customize the BI dashboard as per your unique requirements.
Our expertise in creating business intelligence dashboards extends to the following -
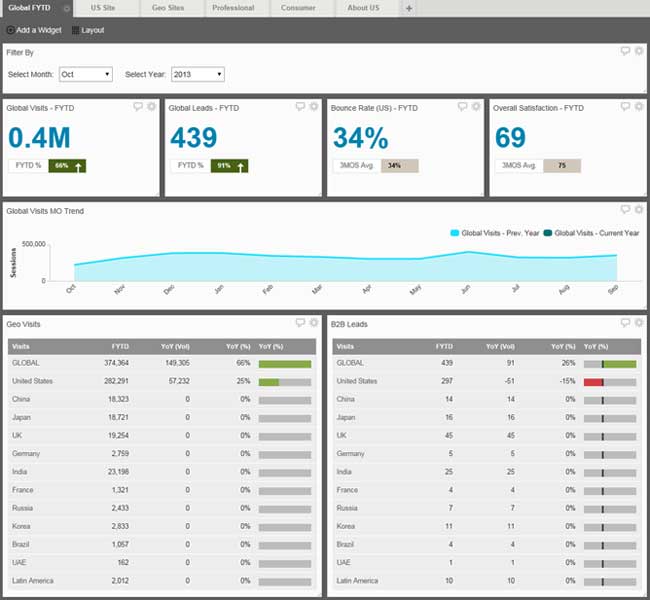
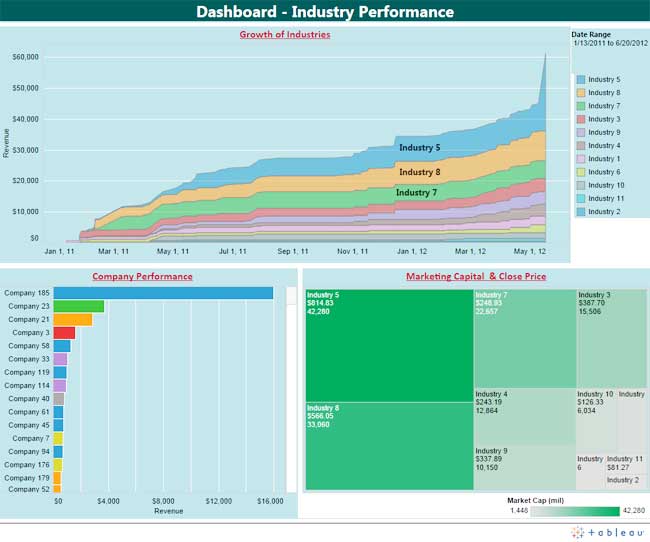
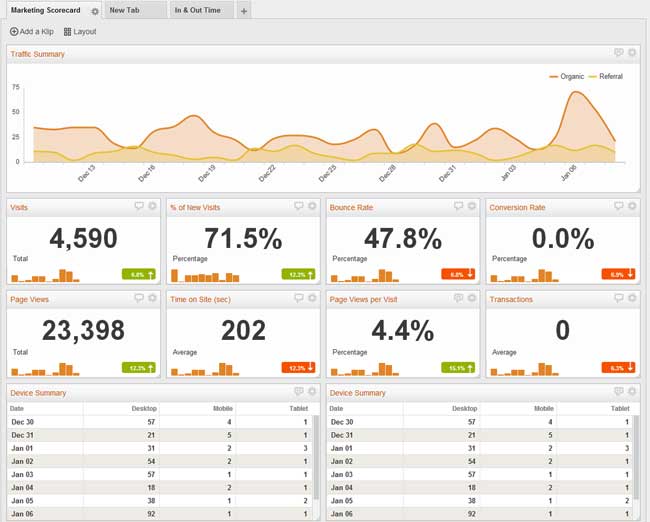
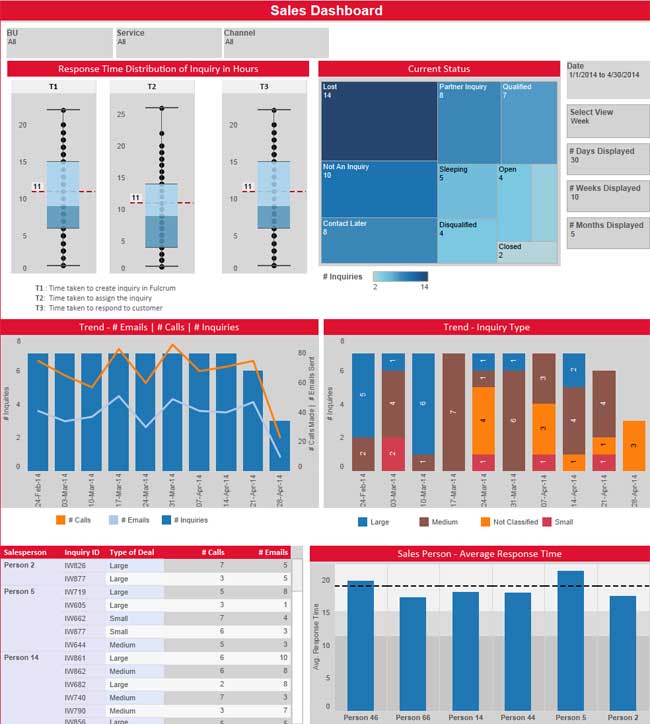
Business Analytics Dashboards
Operational Dashboards
Marketing Dashboards
Executive Dashboards
Metrics Dashboards
Sales Dashboards
Performance Dashboards
KPIs Dashboards
Flatworld's BI Dashboard Visualization and Creation Process
 1
1 Combine
Upload and combine your data from our multiple sources, including CSV, Excel, XML, TXT, or JSON. We have substantial support for some of the most commonly used APIs out there, such as OAuth, GET/POST, RESTful, X-WSSE, SOAP, etc.
2 Analyze
Our visualization experts can help to unify disparate data into a centralized dashboard. Our dashboards allow you to keep a keen eye on your KPI and analyze it accurately
3 Share
Our streamlined data connectors, including in-built support for Box, Dropbox, Google Analytics, Google Drive, Facebook, etc., ensure your data can always be accessed from wherever you want. This further makes collaboration easy and hassle-free
Key Features of our Business Intelligence Dashboard Creation Services
Our fully-interactive and real-time dashboards come with advanced capabilities for the pro-user, but at the same time can be used by anyone without any prior training. Some of the features which set our BI dashboards apart from the rest of our competitors include -
Accessibility
Our dashboards can be accessed whenever required from a multitude of devices including mobile phones and tablets. Data is automatically synced through the cloud, ensuring all visualizations are updated on a real-time basis
Short Time-frame
From capturing the data to dashboard creation, to the dashboard going live, we ensure all your requirements are met within as short a time period as possible (Typically 3 weeks)
Safety and Security
Our security protocols ensure your entire data remains safe from outside intrusions. Multiple redundancies further ensure no data is lost at any point of time
Easy Collaboration
Not only can the dashboards be visualized on cloud-connected devices, but can also be easily shared with your co-workers, etc., through PDFs and emails. Users can also leverage its automation features including scheduling daily emails, etc.
Transparent Costs
Our pricing structure is transparent and does not have any upfront costs. So, you can have peace of mind while outsourcing your requirements to us
Fully-managed Services
No software installation is required for you to get started, as our web-based dashboards ensure very little groundwork has to be completed at the client's end
Why Choose Flatworld Solutions for BI Dashboard Creation?
Our dynamic dashboards have become the analytical and reporting tool for countless data driven business leaders across the globe. By choosing Flatworld, you stand to gain from the following -
Trained workforce with a minimum of 5 years of experience in the relevant domains to ensure that your data is always projected accurately and in the best way possible.
Access to the latest data, allowing you to receive updates as they happen. Data is automatically synced through the cloud and represented as a constantly self-updating dashboard
An extensive user account control to ensure that your data is visible on a per-user basis, thereby providing you a granular control over who sees what
A proven track record of providing timely and cost-effective solutions to global partners which leverage our core competencies including state-of-art infrastructure, in-house technical skills, etc.
Hire Flatworld for Impeccable BI Dashboard Visualization Services
At Flatworld Solutions, we differentiate our services by making sure our dashboards are built for all kinds of business users including top management as well as data analysts. This ensures that everyone can receive business insights a glance and make quicker business decisions, whenever required. Hundreds of businesses, ranging from Fortune 500 companies to up-and-coming startups are leveraging our BI dashboards to uncover valuable insights and making game-changing decisions.
Contact us now to create business intelligence dashboards and make real-time data driven evaluations.
Business Intelligence Dashboard Creation FAQs
Live chat with us
USA
Flatworld Solutions
116 Village Blvd, Suite 200, Princeton, NJ 08540
PHILIPPINES
Aeon Towers, J.P. Laurel Avenue, Bajada, Davao 8000
KSS Building, Buhangin Road Cor Olive Street, Davao City 8000
INDIA
Survey No.11, 3rd Floor, Indraprastha, Gubbi Cross, 81,
Hennur Bagalur Main Rd, Kuvempu Layout, Kothanur, Bengaluru, Karnataka 560077
